The significance of air quality as a vital aspect of environmental and public health is undeniable, particularly in India, where efforts to curtail air pollution and implement effective countermeasures are crucial. Establishing a strong network for monitoring ambient air quality is essential in this context. As per the Ministry of Environment, Forest and Climate Change (MoEF&CC), Government of India, the nation boasts a network of 1296 ambient air quality monitoring stations (refer Table 1). Spread across 473 cities in 28 States and 7 Union Territories, these stations ensure a thorough evaluation of air quality across the country. This extensive network is instrumental in gathering critical information for decision-makers and researchers. The ‘Control of Pollution Scheme’ is vital to sustaining and enhancing this monitoring network. For the fiscal year 2021-22, the National Ambient Air Quality Monitoring Programme (NAMP) received an allocation of Rs. 64.25 Crores. Of this, Rs. 58.17 Crores were spent on essential aspects like Operation and Maintenance (O&M) of NAMP stations, expanding PM2.5 monitoring, and setting up new manual monitoring stations. A further Rs. 3.85 Crores was allocated for the O&M of Continuous Ambient Air Quality Monitoring (CAAQM) Stations, with the Central Pollution Control Board (CPCB) managing 14 such stations.
The CPCB has also established specific guidelines for staffing these monitoring stations, indicating the need for one Scientific Assistant and three Field Assistants at each station, with variations based on the city’s number of stations. This policy underscores the need for sufficient staffing to ensure the accuracy and reliability of the collected data.
Table 1. Air Quality Monitoring Stations in India under Automatic and Manual
| Sl. No. | State/ Union Territories | Real-time under (CAAQMS) | Manual under (NAMP) | ||||
| No. of cities | No. of stations | No. of cities | No. of stations | ||||
| 1 | Andhra Pradesh | 7 | 8 | 15 | 72 | ||
| 2 | Arunachal Pradesh | 1 | 1 | 2 | 2 | ||
| 3 | Assam | 3 | 5 | 13 | 31 | ||
| 4 | Bihar | 25 | 35 | 7 | 8 | ||
| 5 | Chhattisgarh | 4 | 10 | 5 | 17 | ||
| 6 | Goa | 0 | 0 | 18 | 18 | ||
| 7 | Gujarat | 6 | 17 | 7 | 24 | ||
| 8 | Haryana | 24 | 30 | 3 | 5 | ||
| 9 | Himachal Pradesh | 1 | 1 | 14 | 25 | ||
| 10 | Jharkhand | 1 | 1 | 7 | 10 | ||
| 11 | Karnataka | 24 | 34 | 18 | 30 | ||
| 12 | Kerala | 8 | 9 | 12 | 29 | ||
| 13 | Madhya Pradesh | 15 | 19 | 15 | 42 | ||
| 14 | Maharashtra | 11 | 41 | 27 | 80 | ||
| 15 | Manipur | 1 | 2 | 1 | 1 | ||
| 16 | Meghalaya | 1 | 2 | 7 | 11 | ||
| 17 | Mizoram | 1 | 1 | 8 | 19 | ||
| 18 | Nagaland | 1 | 1 | 2 | 10 | ||
| 19 | Odisha | 10 | 10 | 16 | 38 | ||
| 20 | Punjab | 8 | 8 | 38 | 52 | ||
| 21 | Rajasthan | 8 | 10 | 8 | 39 | ||
| 22 | Sikkim | 1 | 1 | 8 | 9 | ||
| 23 | Tamil Nadu | 13 | 22 | 16 | 55 | ||
| 24 | Telangana | 3 | 14 | 11 | 25 | ||
| 25 | Tripura | 1 | 2 | 1 | 2 | ||
| 26 | Uttar Pradesh | 20 | 57 | 27 | 84 | ||
| 27 | Uttarakhand | 1 | 1 | 6 | 12 | ||
| 28 | West Bengal | 6 | 14 | 44 | 83 | ||
| 29 | Andaman & Nicobar (UT) | 0 | 0 | 2 | 3 | ||
| 30 | Chandigarh (UT) | 1 | 3 | 1 | 5 | ||
| 31 | DNH and Daman & Diu (UT) | 0 | 0 | 4 | 6 | ||
| 32 | Delhi (UT) | 1 | 40 | 1 | 10 | ||
| 33 | Jammu & Kashmir (UT) | 1 | 1 | 18 | 31 | ||
| 34 | Lakshadweep (UT) | 0 | 0 | 1 | 1 | ||
| 35 | Pondicherry (UT) | 1 | 1 | 2 | 6 | ||
| Total | 209 | 401 | 385 | 895 | |||
Source: MoEF & CC (2022) [https://sansad.in/getFile/annex/258/AU1009.pdf?source=pqars]
Air Quality Monitoring System in India
A detailed analysis of India’s air quality monitoring systems reveals significant differences in the deployment of Continuous Ambient Air Quality Monitoring Systems (CAAQMS) and National Ambient Air Quality Monitoring Programme (NAMP) stations across various states and Union Territories (UTs). This distribution mirrors the strategic focus and allocation of resources for environmental monitoring, which is vital in tackling the complex issues related to air pollution. Notably, states like Maharashtra, Tamil Nadu, and Uttar Pradesh have a higher concentration of CAAQMS. This indicates a deliberate effort to boost real-time air quality monitoring in regions with dense populations and industrial activities. The real-time data provided by these systems in these states is crucial for prompt and effective policy measures to address sudden changes in air quality, thus mitigating the immediate health hazards of air pollution.
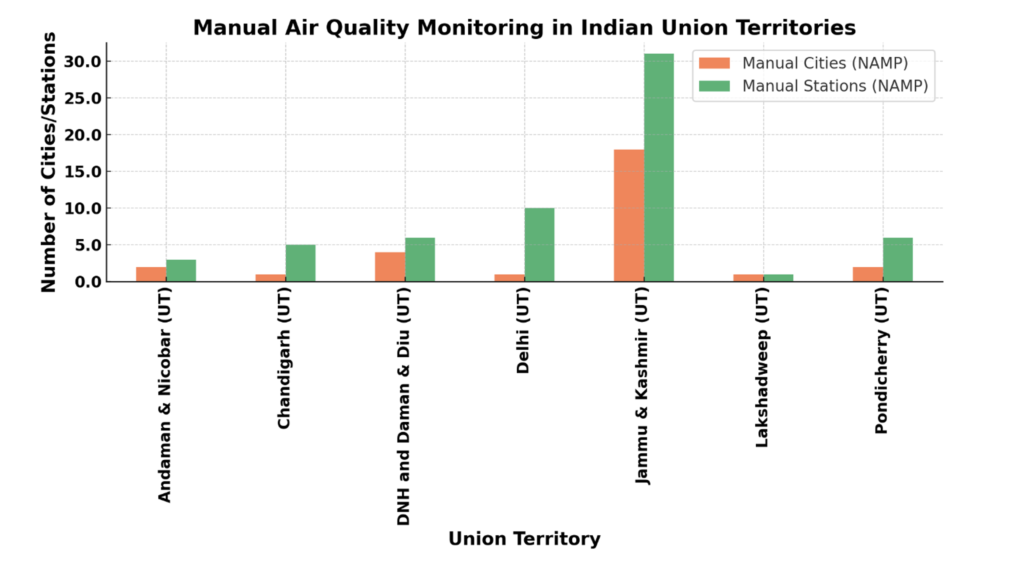
In contrast, the spread of NAMP stations represents a different picture. For example, Andhra Pradesh leans more towards manual monitoring systems. Although they are more cost-effective and valuable for long-term environmental tracking, the above-stated systems may fall short in responding swiftly to sudden pollution spikes. The inherent delay in data collection and analysis with manual methods could slow the response to environmental issues. In the case of Union Territories, a mixed approach is evident. Delhi, a key UT, shows a well-rounded monitoring network that includes CAAQMS and NAMP stations. This reflects the high environmental pressures it faces and the administrative focus on air quality control. Delhi’s approach highlights the benefits of real-time and long-term monitoring capabilities.
The varied distribution of monitoring stations across states and UTs highlights the necessity for a more integrated and balanced air quality monitoring strategy. Such a strategy should combine the immediate advantages of real-time monitoring with the long-term perspectives offered by manual methods, thereby promoting fair and effective environmental health management.
Figure 1. State-wise real-time Air Quality monitoring system in India
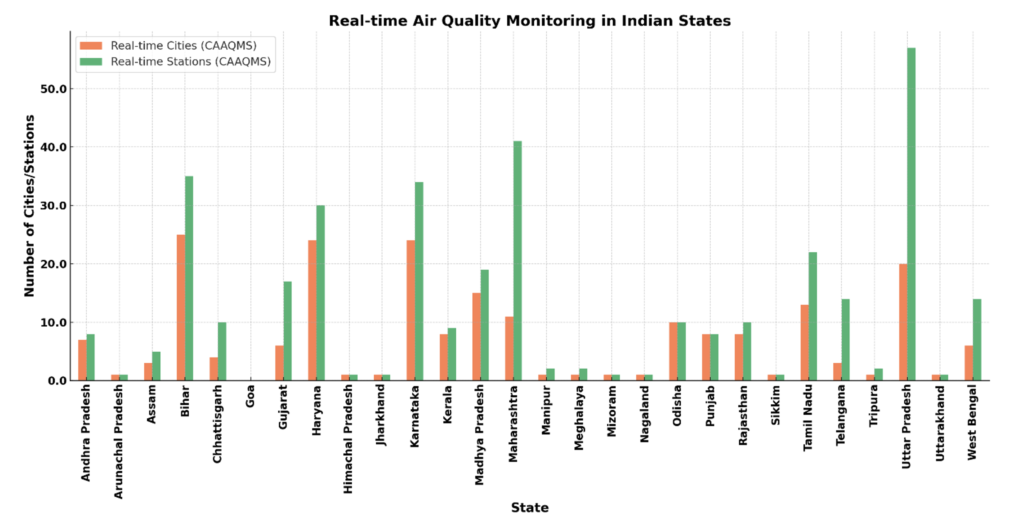
Figure 2. State-wise Manual Air Quality Monitoring System in India
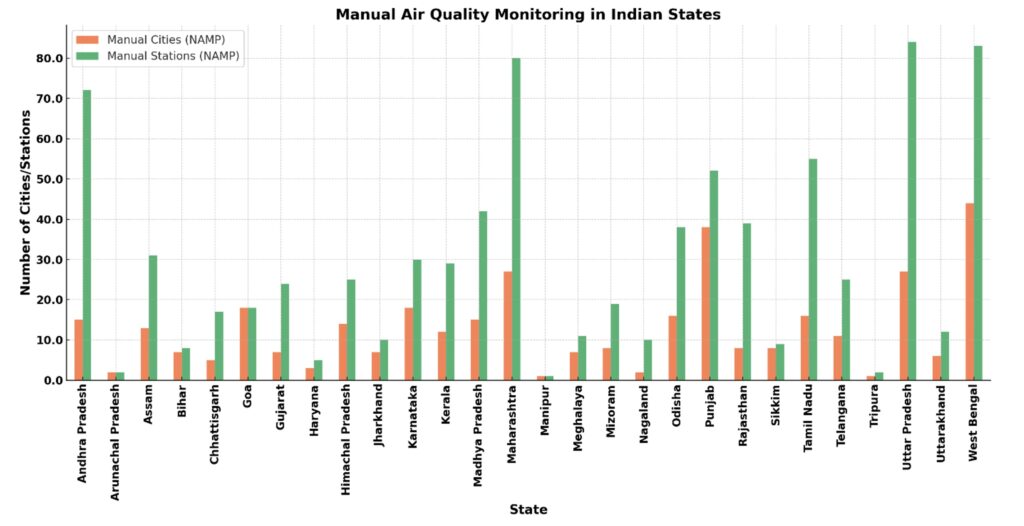
Figure 3. Real-time Air Quality Monitoring System in Indian UTs
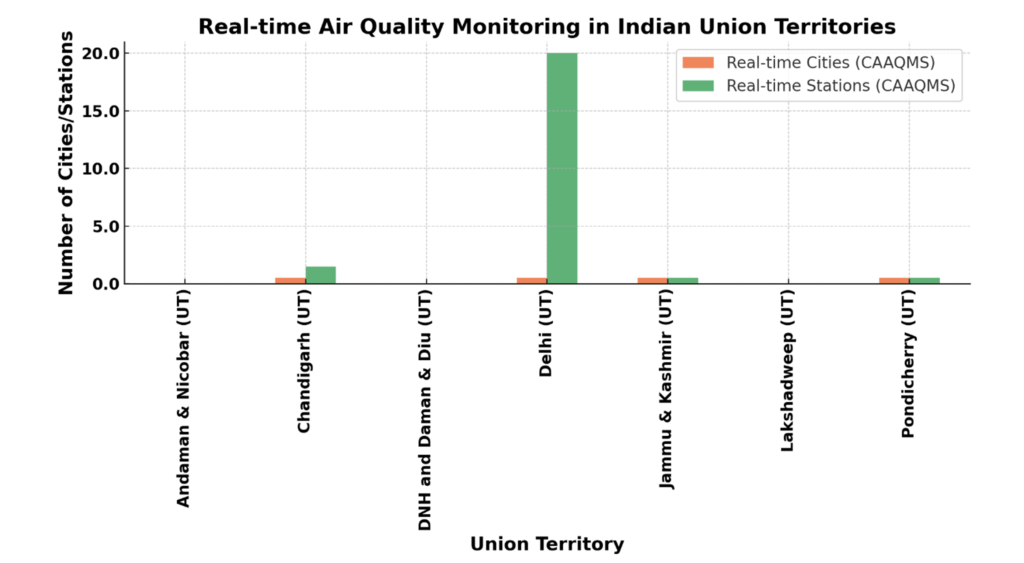
Figure 4. Manual Air Quality Monitoring System in Indian UTs
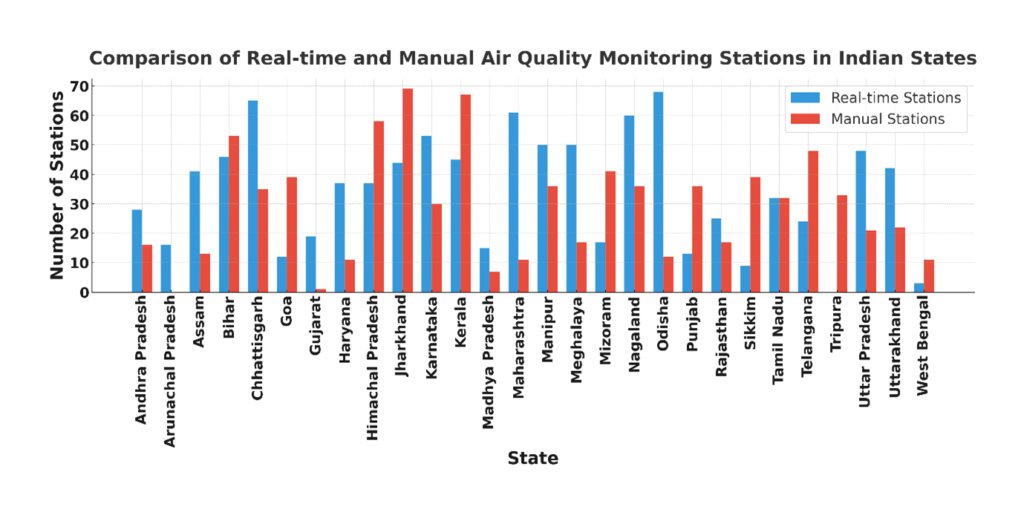
Comparison of Real-time and Manual Air Quality Monitoring Stations
A close look at the air quality monitoring stations in various Indian states, as illustrated by the bar chart, shows a distinct disparity. Uttar Pradesh, for instance, has a high number of manual monitoring stations, indicating a preference for the traditional method of air quality assessment. On the other hand, Maharashtra is leaning more towards real-time monitoring stations, showcasing a move towards a more immediate and technologically advanced approach to environmental observation. States like Odisha, Punjab, Tamil Nadu, and West Bengal predominantly rely on manual stations, possibly suggesting a slower adoption of new technologies in this field. In contrast, the commitment of Karnataka and Maharashtra to real-time stations highlights a forward-thinking attitude in environmental monitoring.
Furthermore, states such as Bihar, Chhattisgarh, Goa, Himachal Pradesh, and Manipur exhibit a limited setup for monitoring air quality, with a modest presence of manual and real-time stations. The overall trend the data indicates is a continued dominance of manual stations. Still, the growing number of real-time stations signals a shift towards recognizing the importance of quick and precise environmental data. This data is vital for informing effective policy decisions and addressing public health concerns related to air quality.
Figure 5. Comparison between Real-time and Manual Air Quality Monitoring systems in India
Sources: Author’s estimations from secondary data provided by Digital Sansad
Reference
MoEF & CC. (2022). Monitoring of Air Pollution, Digital Sansad. Retrieved December 12, 2023, from https://sansad.in/getFile/annex/258/AU1009.pdf?source=pqars